- www.wiseup.club
- Hotline - (345 936 9473)
- [email protected]

Reports help you to get an overview of your entire business.
To view report click on Reports & Select the report you want to view.
Some Reports come filter relevant options to help you analyze your business better.
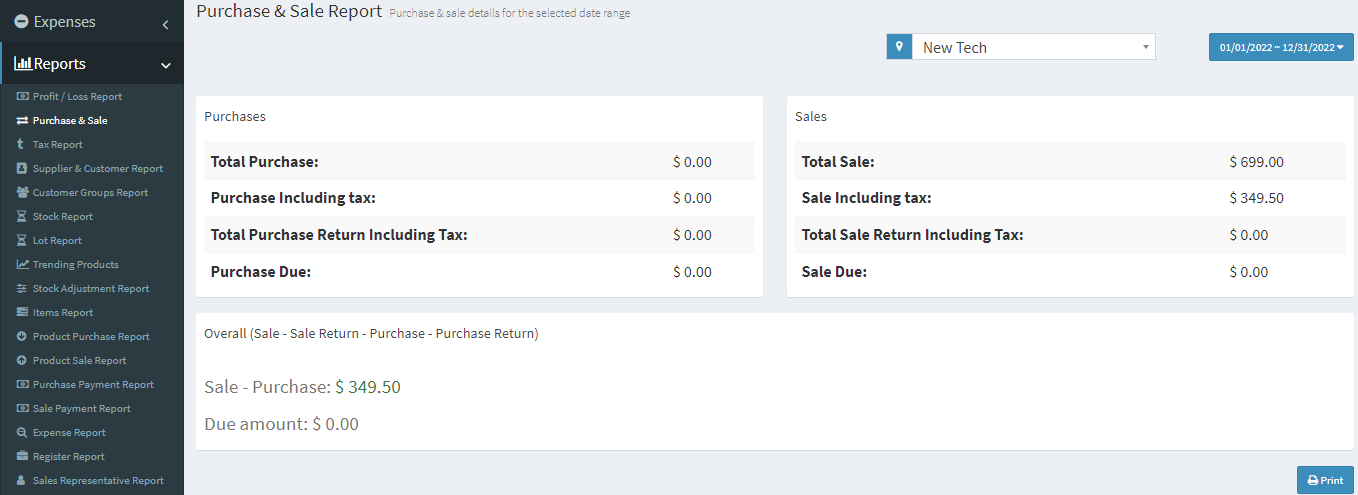
This report shows the total purchase, Purchase Including tax, Purchases with Dues amount; and Total Sale, Sale Including tax, Sale Due.

Shows the Input & Output Taxes.
This report shows the details of Purchase & Sell with all contacts (Suppliers & Customers) and also any Due amount. Positive Due amount indicates payment by contact, negative indicates payments to the contact.

The stock report displays the stock details. With this, you can track remaining stock and total sold quantity sold for all products.
For variable products – you can click on Green Plus button before SKU column to get details stock report for each product variations.
Expense report helps you to analyze expenses for business locations and also analyze based on expenses categories.
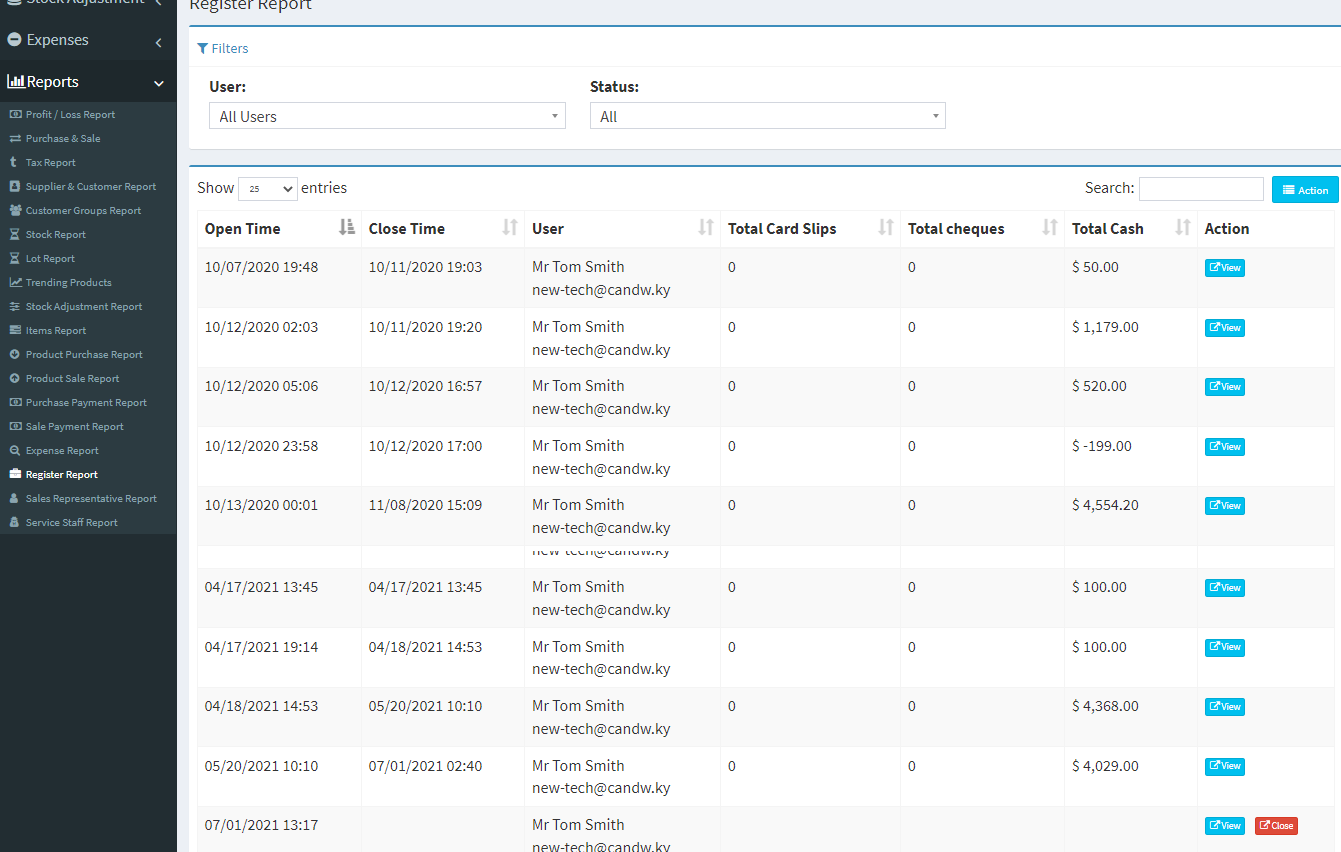
View details of all registers and filter registers based on User and/or Status (Open or Closed)

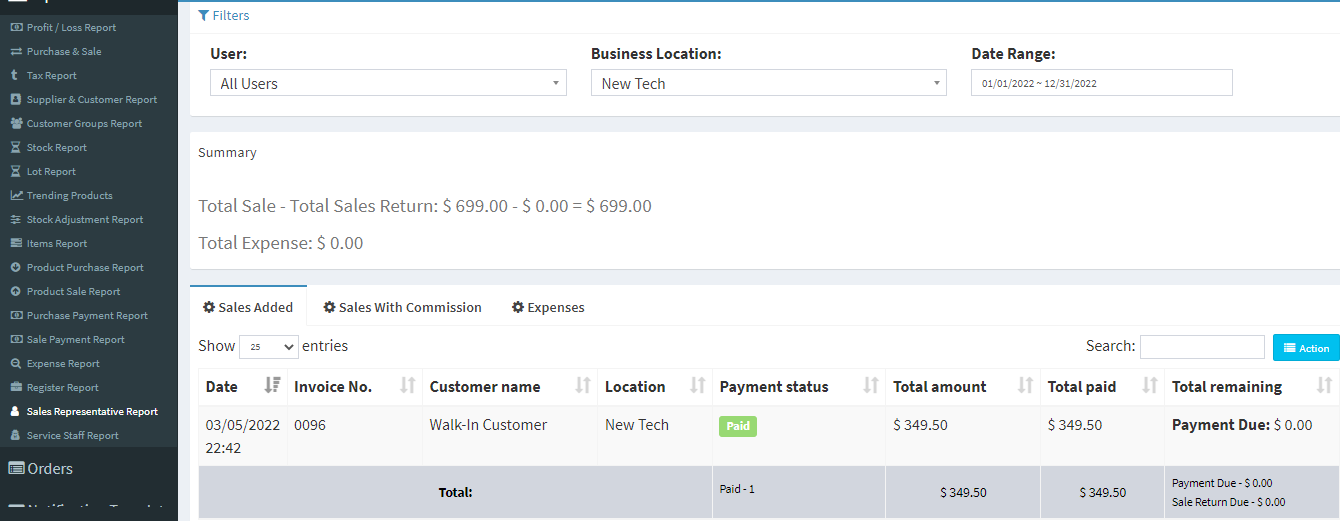
View Sales and Expenses details of Sales representative
